Education only. This article explains a charting tool. It is not financial advice, and no indicator can promise where price will go. Futures trading carries a real risk of loss.
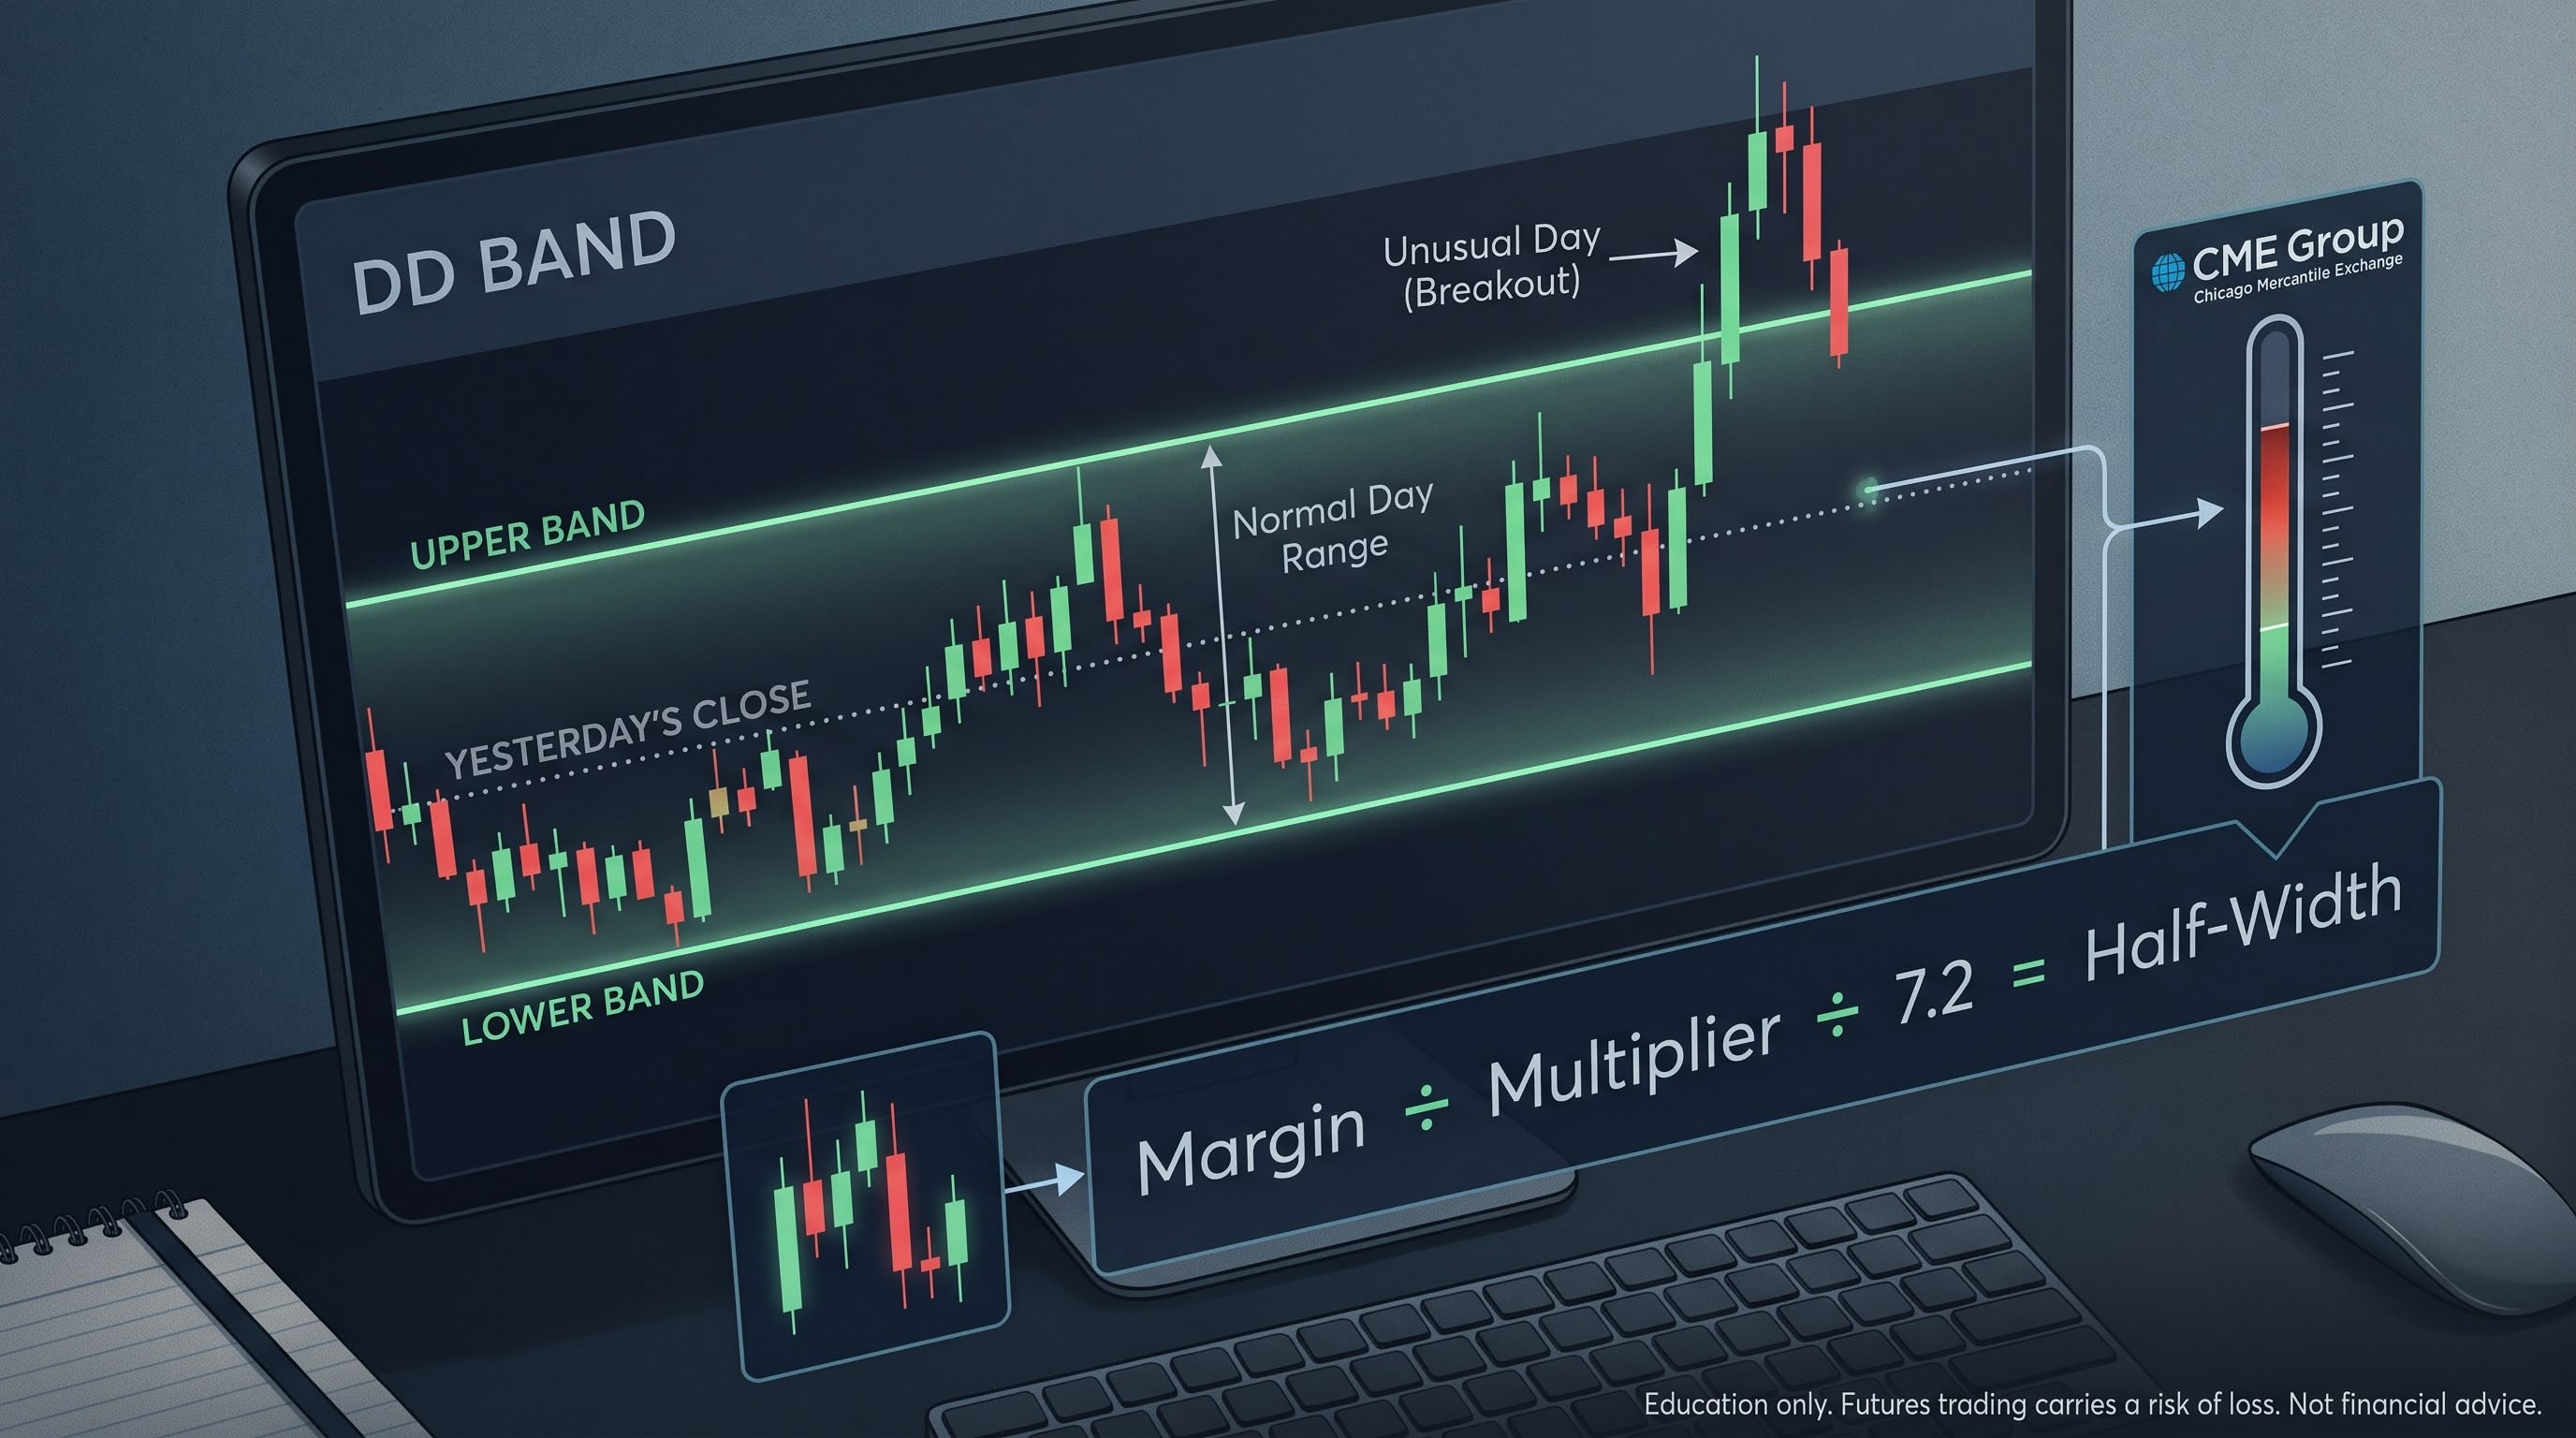
If you trade E-mini S&P 500 (ES) or E-mini Nasdaq 100 (NQ) futures, you have probably asked the same question every morning: how far can price reasonably move today? The DD Band is one simple answer. It draws two lines on your chart, one above and one below yesterday's close, and treats the space between them as a "normal day" range.
This guide explains what the DD Band is, where its width comes from, how it is calculated step by step, and how an automated system can keep it up to date every day.
What Is the DD Band?
The DD Band is a daily price range for futures. Each day it gives you two numbers:
- an upper band, above the previous close
- a lower band, below the previous close
The idea is straightforward. On most days, price wanders around inside this zone. When price reaches a band, it has travelled about as far as a typical day allows. Traders watch those edges because that is where moves often slow down, reverse, or turn into something unusual.
Think of it as a fence around a normal trading day. Price can cross the fence, but when it does, the day is behaving differently from usual and that is useful to know.
Why Traders Use a Daily Range Like This
A daily range helps with three common problems.
Setting expectations. If NQ has already moved close to its upper band by 10 AM, a further large move is less likely than a small pullback. Knowing the range keeps expectations realistic.
Planning targets and stops. Instead of guessing a profit target, you can use the bands as reference points. A long trade near the lower band has room to run toward the middle. A long trade near the upper band does not.
Spotting unusual days. When price closes well outside the band, something out of the ordinary happened, such as a news event or a sudden volatility shock. The band turns "this feels big" into something you can see on the chart.
The Key Idea: The Width Comes From Margin
Most range tools measure recent price movement. The DD Band starts somewhere different: futures margin.
What is futures margin?
Margin is the amount of money a trader must hold with the broker to keep a futures position open. The exchange, CME Group, sets the margin for every contract.
What is SPAN?
CME calculates margin with a risk system called SPAN (Standard Portfolio Analysis of Risk). SPAN looks at how much a contract could lose under many different market scenarios, then sets a margin that covers those losses.
Why margin is a useful ruler for price
When markets turn wild, CME raises margins. When markets calm down, it lowers them. So margin acts like a risk thermometer set by people whose job is to measure risk. A bigger margin means the exchange expects bigger possible moves, so the band should be wider. A smaller margin means a narrower band.
That is the whole concept: let the exchange's own risk number set the width of the daily range.
How the DD Band Is Calculated
Here is the calculation in one line:
half-width (points) = front-month maintenance long margin (USD)
                      ÷ contract multiplier (USD per point)
                      ÷ scale factor (7.2)

upper band = previous close + half-width
lower band = previous close − half-width
Each part is explained below.
Step 1: Get the margin
Take the margin CME publishes for the front-month contract. There are different margin types. This method uses the maintenance margin for a long position, which is the amount needed to keep a bought contract open.
Step 2: Convert dollars into points
Margin is in dollars, but a chart is in points. To compare them, divide by the contract multiplier, which is the dollar value of one point:
- ES: $50 per point
- NQ: $20 per point
A dollar amount must never be used directly as a price distance. Dividing by the multiplier turns it into "how many index points this margin represents."
Step 3: Scale it down to a daily distance
Margin in points is far larger than a normal day's move. It is built to cover a bad scenario, not an average day. So it is divided by a scale factor to shrink it into a one-day range. In this version the scale factor is 7.2. The next section explains where that number comes from and how sure we are about it.
Step 4: Add and subtract from the previous close
Take the previous close, add the half-width for the upper band, and subtract it for the lower band. Finally, round each band to the contract's tick size, 0.25 points for both ES and NQ.
Worked example: NQ
ItemValueFront-month long maintenance margin$42,688Contract multiplier$20 per pointMargin in points42,688 ÷ 20 = 2,134.4Half-width2,134.4 ÷ 7.2 = 296.44 pointsPrevious close30,185.75Upper band30,482.25Lower band29,889.25
Worked example: ES
ItemValueFront-month long maintenance margin$26,167Contract multiplier$50 per pointMargin in points26,167 ÷ 50 = 523.34Half-width523.34 ÷ 7.2 = 72.69 pointsPrevious close7,771.50Upper band7,844.25Lower band7,698.75
Notice that NQ gets a much wider band in points than ES. That is expected, because NQ's price is higher and it moves more points per day.
Which previous close is used?
The band is centred on the futures price at the last minute before 4:00 PM Eastern on the previous trading day. This is a practical stand-in for the closing price and is not the official CME settlement price, which can differ slightly.
How Honest Is the 7.2 Scale Factor?
This part matters, so it is worth stating plainly.
The number 7.2 is not a published constant. It was found by matching the calculation to a DD Band shown on a charting indicator on one specific day, October 14, 2026. For ES the match needed a factor of 7.17, and for NQ it needed 7.21. One value, 7.2, reproduced both bands to within about 0.6%.
That is encouraging, because two different contracts with different prices and multipliers landed on almost the same number. But it is still one day of evidence. The honest summary is:
- The method matches one day closely.
- It has not been proven over many days.
- The scale factor may need adjusting when CME changes margins.
- The method behind the original DD Band indicator is not public, so this is a close copy of it and may not be identical.
If you use it, check it against your own chart over time. If the bands drift, the scale factor is the number to refit.
What About the "Most Days Close Inside" Claim?
You may see people say that around 88% of days close inside DD-style bands. That figure comes from third-party descriptions of the original indicator. It has not been verified here, so treat it as a claim and not as a fact. A simple test would be to log every day's close for a few months and count how many finished inside the band. Anyone relying on a probability should measure it first.
How to Read the DD Band on a Chart
A few simple habits make the band useful.
- Start with where price opens. If price opens inside the band, the band is your map for the day. If it opens outside, the day is already unusual.
- Watch the edges. A touch of the upper or lower band is a moment to slow down and look at what price does next, not an automatic signal to trade.
- Respect a break. If price moves clearly beyond a band, a normal-day assumption no longer applies. Many traders treat that as a reason to be careful instead of chasing.
- Combine it with other information. The band says nothing about direction. Pair it with levels, volume, or your own plan.
How the Automatic Version Works
The version described here updates itself every day. This is how the pieces fit together.
- A daily download. At 6:00 AM Eastern, a program on the server opens the CME margin download for ES and NQ and saves the files.
- Careful checking. The files are validated before use. The program checks the product name, the contract month, that every margin is a positive number, and that the file is not empty or an error page. If anything fails, yesterday's files stay in place.
- A saved history. Every downloaded file is kept, so you can compare margins over time and test the method later.
- Calculation during the day. On weekdays, the engine refreshes every five minutes. It reads the latest valid margin file, finds the front-month row, takes the previous close, and applies the formula.
- Drawing the lines. A browser extension reads the result and draws the two lines on TradingView or Robinhood charts. It can be turned on by its own switch, separate from the other chart levels.
What happens if something breaks?
- If the download fails, the last good margin files keep being used for up to 14 days.
- After that, the system switches to a different range based on options prices, and labels it Range so you never mistake it for a DD Band.
- Every step is logged, so you can see when the last successful download happened.
Limits to Keep in Mind
- It does not predict direction. The band is a ruler, not a forecast.
- The scale factor is a fit. It matches one observed day and needs ongoing checking.
- The close is an approximation. It uses the 3:59 PM Eastern minute price, not the official settlement.
- Large news days break any range. A central bank decision or surprise event can carry price far past the band.
- Past behaviour is not a guarantee. No daily range can promise how a future session will finish.
Frequently Asked Questions
What does DD stand for?
The name comes from the indicator that popularised this style of band. Its creators and exact method are not public, so this guide uses the name only to describe a daily band based on exchange margin.
Is the DD Band the same as the expected move from options?
No. The expected move uses implied volatility from options prices. The DD Band described here uses exchange margin. They often land in similar places on normal days and can drift apart when volatility changes quickly.
Does the band work on other futures?
The method needs a margin and a contract multiplier, so it could be extended to other contracts. This version covers ES and NQ only.
How often does it change?
The previous close changes daily, so the band moves every day. The width changes only when CME changes its margins, which usually happens every so often and not every day.
Can I rely on it for trading decisions?
Use it as one reference among several, and test it against your own records first. The scale factor is based on limited evidence.
Key Takeaways
- The DD Band is a daily range: previous close plus and minus a distance.
- The distance comes from CME margin, converted from dollars to points and scaled to a daily move.
- The formula is simple: margin ÷ multiplier ÷ 7.2.
- The 7.2 factor is a fit to one day, not a proven constant.
- The system can download, check and update itself each day, and falls back safely when something fails.
- Use it as a map of a normal day, not as a prediction.
Disclaimer: This content is for educational purposes only and does not constitute investment advice or a recommendation to trade. Trading futures involves substantial risk of loss. Test any tool on your own data before using it with real money.
Was this worth your time?